Restaurant industry statistics 2026
Restaurant industry statistics for 2026: US sales, openings, top states, failure rates, and live pre-open pipeline data pulled from public liquor and permit filings.
Most restaurant statistics tell you what already happened. This page does that, and then shows you what’s happening right now.
Below are the 2026 numbers worth knowing: how big the US restaurant industry is, how many restaurants open each year, which states lead, and the real failure rate. Then a section almost nobody publishes, the live pre-open pipeline, pulled straight from public filings.
Here are the restaurant industry statistics that actually matter in 2026, sourced and dated, with a live look at the restaurants applying to open this week.
Every national figure below is attributed to its source. The pipeline numbers come from the public datasets RestoSignals ingests, pulled in October 2026.
How big is the US restaurant industry in 2026?
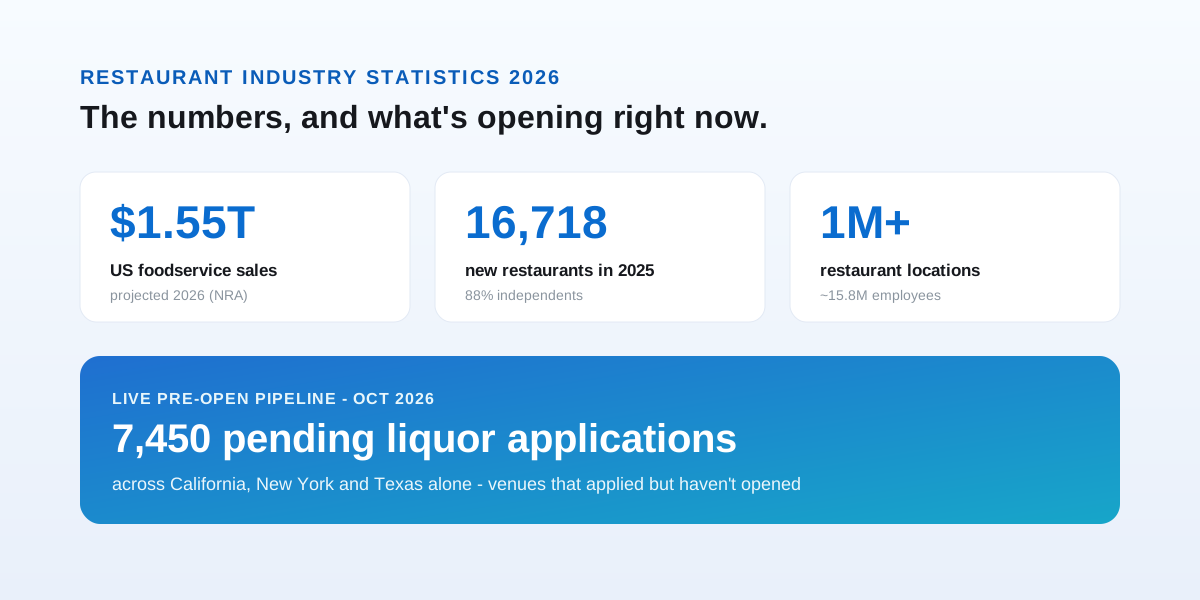
The US restaurant industry is on track for about $1.55 trillion in sales in 2026, with more than 1 million locations and roughly 15.8 million employees. That’s a 4.8% jump in sales over 2025, per the National Restaurant Association, though most of it is menu pricing, not more diners. Strip inflation out and real growth is closer to 1.3%.
Here are the headline numbers.
| Metric | 2026 figure | Source |
|---|---|---|
| Total sales | ~$1.55 trillion | NRA State of the Industry 2026 |
| Locations | 1 million+ | NRA |
| Employees | ~15.8 million | NRA |
| Jobs added in 2026 | 100,000+ | NRA |
| Real (inflation-adjusted) sales growth | ~1.3% | NRA |
The takeaway: the industry is still growing, but on thin, pricing-driven margins. Operators are cost-conscious, which makes the pre-open window, before vendor contracts are signed, more valuable to sellers, not less.
The National Restaurant Association frames 2026 as a year of measured growth. Demand is holding, but a cooling labor market, higher input costs, and cautious household spending keep squeezing margins. That’s why so much of the 4.8% sales bump is price, not traffic.
How many people does the restaurant industry employ?
The restaurant industry is one of the largest private employers in the US, with about 15.8 million workers forecast for 2026 and more than 100,000 jobs expected to be added, per the National Restaurant Association. That’s close to a tenth of the entire US workforce.
Growth is cooling, though. Industry trackers describe a softer labor market in 2026, with operators hiring more cautiously than they did in the post-pandemic rebound.
For vendors, hiring is its own pre-open tell. A venue posting for a general manager or line cooks is usually weeks from opening, which lines up with the license and permit signals in the pipeline data below.
How many new restaurants open in the US each year?
About 16,718 new restaurants opened in the US in 2025, and roughly 88% of them were independents, per RestaurantData’s year-end report. Counting every type of food-service establishment, the broader figure often lands near 50,000 a year. Independents dominate, which matters because they’re the operators who haven’t been sold to yet.
The 2025 breakdown looked like this.
| Segment | 2025 openings | Share |
|---|---|---|
| Independent restaurants | 14,750 | 88.2% |
| Multi-unit chain concepts | 1,788 | 10.7% |
| All tracked new restaurants | 16,718 | 100% |
Independents are the story. They open one location at a time, they choose their own vendors, and they’re the bulk of every pre-open lead list.
The mix skews casual. By segment, casual and family concepts made up a bit over half of 2025 openings, fast casual close to a third, quick serve around 11%, and upscale dining about 5%, per RestaurantData.
| Segment | Share of 2025 openings |
|---|---|
| Casual / family | ~52% |
| Fast casual | ~30% |
| Quick serve | ~11% |
| Upscale dining | ~5% |
By cuisine, Mexican and Latin food led every category at roughly 15% of 2025 openings. That’s useful to know if you sell into a specific concept type, because the pending-application feeds below carry the license class, which hints at the format before the venue ever opens.
Which states open the most restaurants?
California, Florida, New York, and Texas open the most restaurants in the US. In 2025, California led with about 3,202 new restaurants, nearly a fifth of the national total, followed by Florida, New York, and Texas. Together those four states accounted for well over half of all tracked US openings.
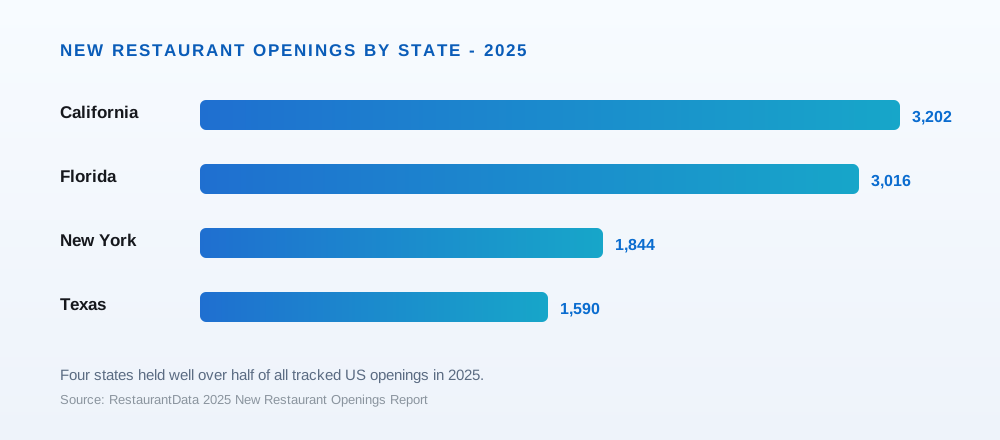
Here’s the ranking.
| State | 2025 new restaurants | Share of US |
|---|---|---|
| California | 3,202 | 19.2% |
| Florida | 3,016 | 18.0% |
| New York | 1,844 | 11.0% |
| Texas | 1,590 | 9.5% |
Source: RestaurantData. The concentration is why most pre-opening data, including ours, is deepest in these high-volume states.
How many restaurants are opening right now?
A lot, and you can count them. As of October 2026, the RestoSignals pipeline tracked about 7,450 pending on-premise liquor applications across California, New York, and Texas alone, each one a venue that applied to serve alcohol but hasn’t opened. Add recently approved licenses in Colorado and new Chicago food and liquor licenses, and the live pre-open flow runs into the thousands at any given moment.
This is the number almost no industry report publishes, because it takes reading the raw public filings. Here’s the live snapshot, pulled in October 2026.
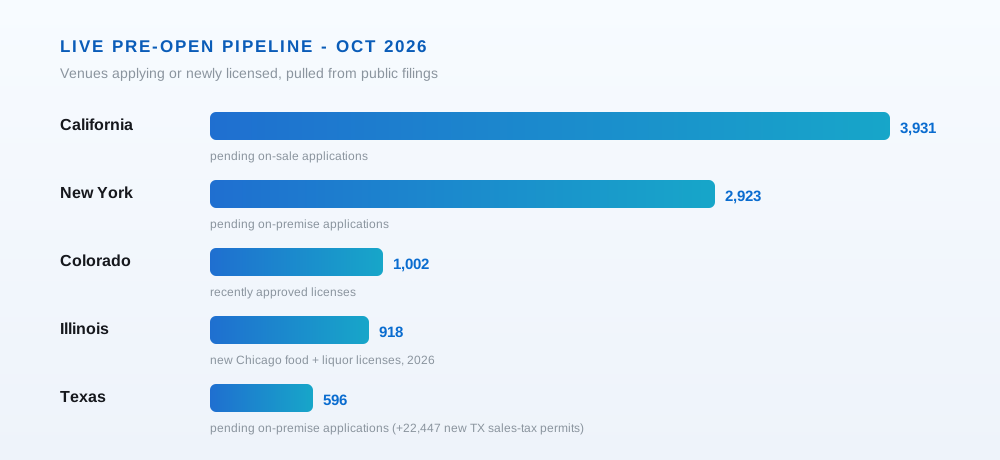
| State | Live pre-open signal | Count (Oct 2026) |
|---|---|---|
| California | Pending on-sale food and drink liquor applications | 3,931 |
| New York | Pending on-premise liquor applications | 2,923 |
| Colorado | Recently approved liquor licenses (past ~12 months) | 1,002 |
| Illinois (Chicago) | New food and liquor licenses issued in 2026 | 918 |
| Texas | Pending on-premise liquor applications | 596 |
A few things stand out.
California and New York alone carry more than 6,800 pending liquor applications right now. That’s thousands of venues mid-application, not yet open.
Texas is a smaller pending-liquor number but a huge business-registration one. The state issued about 22,447 new food and drink sales-tax permits (NAICS 722) in the past year, which is the other half of the pre-open signal.
And it’s local when you zoom in. The Dallas-Fort Worth metro alone held 123 pending on-premise applications, and Los Angeles County held 777 pending food and drink applications, in the same October snapshot.
These counts move daily, because new applications land every day. That’s the point: the pre-open pipeline is a live feed, not an annual report.
How early do restaurants become visible before opening?
Restaurants become visible in public records weeks to months before they open. RestaurantData reports that about 85% of new-opening leads are identified 2 to 12 weeks before opening, with some spotted as early as six months out. And about 99% of those pre-open leads ultimately open for business, so the signal is reliable, not speculative.
The reason is timing. An operator files a liquor application during buildout, because approval takes weeks.
The application lands in a public dataset while the restaurant is still a construction site.
By the time it appears on a dining guide or a reservation app, it’s already open, and already buying from the vendors it chose months earlier.
Why the pre-open window matters
The pre-open window matters because that’s when the money gets committed. About 71% of operators finalize their key vendor decisions before the grand opening, and the average restaurant runs more than 40 vendors, per RestaurantData. Reach an owner during buildout and you’re early. Reach them after opening and the POS, the distributor, and the insurance are already locked in.
That’s the whole case for selling into new restaurants before they open, which I wrote up as a full playbook: how to sell to new restaurants before they open.
The data backs the strategy. Thousands of venues are mid-application at any moment, 99% of them open, and most of their buying happens before the doors do.
How many restaurants are closing in 2026?
Closures are real, but they’re churn, not collapse. Texas led the nation in restaurant closures in the first half of 2026, and the Dallas-Fort Worth metro alone accounted for about 120 of them, roughly 30% of the state’s total and the third-most of any US metro, per the Dallas Morning News. Even so, North Texas added restaurants on net.
That pattern holds nationally. Restaurants open and close constantly, and a big closure count usually sits next to an even bigger opening count in the same market.
The headline closure numbers also lag reality, because many venues shut quietly without filing anything. Openings are the opposite: a restaurant can’t open without a liquor application, a permit, and a sales-tax number, so the pre-open signal is cleaner data than the closure signal.
That’s worth remembering when you read a scary closure headline. The flow of new openings is still the larger, and more measurable, half of the churn.
What percent of restaurants fail in the first year?
Far fewer than you’ve heard. The 90% first-year failure claim is a myth traced to a 2003 commercial, not a study. Bureau of Labor Statistics data puts real first-year closure near 17%, and Datassential measured just 0.9% for 2025 openings, its lowest reading since 2018.
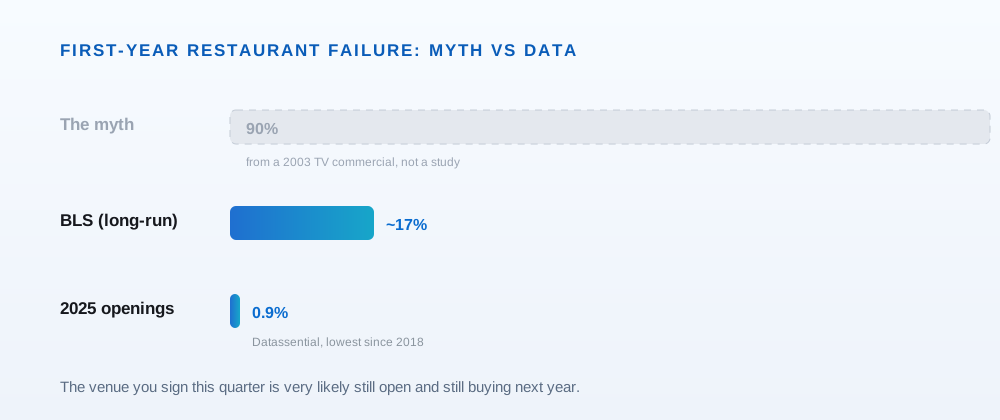
Here’s the comparison.
| Claim | First-year closure rate | Source |
|---|---|---|
| The myth | 90% | A 2003 TV commercial, no study |
| Real rate (long-run) | ~17% | Bureau of Labor Statistics data |
| 2025 openings | 0.9% | Datassential |
Why it matters for anyone selling to restaurants: the venue you sign this quarter is very likely still open and still ordering next year. A pre-open account isn’t a gamble, it’s a customer with a multi-year lifespan.
Where these restaurant statistics come from
The pipeline numbers on this page come from public records that RestoSignals reads every day. State alcohol boards publish pending liquor applications. State and city registries publish new business and sales-tax permits. Cities publish building permits. Each filing appears weeks to months before a restaurant opens.
RestoSignals ingests those sources across its live states, with the deepest data in California, New York, Texas, Illinois, and Colorado. It dedups the records, fuses the ones that agree on the same venue, and scores each one by how likely it is to be a real, soon-to-open restaurant.
Then it serves them as a REST API and a hosted MCP endpoint, so a sales team or an AI agent can pull this week’s openings in one call. The free tier is 100 leads, no card.
If you want the city-level how-to, the guides for New York, Chicago, Los Angeles, and Dallas show the exact filters behind these numbers.
The one statistic that pays
Most of the numbers on this page are context. One is a to-do list: the thousands of restaurants with a pending liquor application right now, in your state, that haven’t chosen a single vendor yet.
Pull that list for your territory, or let an API return it scored. The restaurants in the 2027 statistics are applying for their licenses today, and they’re already public.
Mukul Dutt is the founder of RestoSignals, an API that surfaces restaurants and bars before they open by fusing public liquor, permit, and business-filing records into one scored venue. Pipeline figures were pulled from public state and city datasets in October 2026.
FAQ
How big is the US restaurant industry in 2026?
The National Restaurant Association projects US restaurant and foodservice sales of about $1.55 trillion in 2026, up 4.8% from 2025, though most of that is menu pricing rather than more diners, so real growth is closer to 1.3%. The industry runs more than 1 million locations and is forecast to employ about 15.8 million people, adding over 100,000 jobs in 2026.
How many new restaurants open in the US each year?
About 16,718 new restaurants opened in the US in 2025, of which roughly 88% were independents, per RestaurantData's year-end report. Counting all food-service establishments the broader figure is often cited near 50,000 a year. Either way, new openings are a steady, large flow, and California, Florida, New York, and Texas lead the country in volume.
Which states have the most new restaurant openings?
In 2025, California led with about 3,202 new restaurants (19.2% of the US total), followed by Florida with 3,016 (18.0%), New York with 1,844 (11.0%), and Texas with 1,590 (9.5%), per RestaurantData. These four states alone accounted for well over half of all tracked US openings, which is why they dominate most pre-opening lead data too.
What percentage of restaurants fail in the first year?
Far fewer than the myth says. The 90% first-year failure claim traces to a 2003 commercial, not a study. Bureau of Labor Statistics data puts real first-year closure near 17%, and Datassential measured just 0.9% for 2025 openings, its lowest since 2018. Most new restaurants are still open and still buying from their vendors a year later.
How many restaurants are opening right now in the US?
As of October 2026, the RestoSignals pipeline tracked about 7,450 pending on-premise liquor applications across California, New York, and Texas alone, each a venue that has applied to serve alcohol but has not opened. Add roughly 1,000 recently approved licenses in Colorado and about 918 new Chicago food and liquor licenses issued in 2026, and the live pre-open flow is in the thousands at any moment.
Where can I get data on restaurants before they open?
From public records. State alcohol boards publish pending liquor applications, state and city registries publish new business and sales-tax permits, and cities publish building permits, each filed weeks to months before opening. RestoSignals fuses those sources into one scored venue and serves them as a REST API and MCP endpoint, so you get pre-open leads without stitching the datasets together yourself.
Find venues opening near you
100 free leads, no card. One platform for restaurants & bars about to open.